Why is some new housing “affordable” but not all of it? If a new block is 40% affordable flats, why not 100%? If it seems baffling, the answer is quite interesting.
Subsidised not Affordable
What politicians and the building industry call “affordable housing” is really “subsidised housing”. If we used that name for it instead, you’d probably have two questions:
- How much is this subsidy?
- Who’s paying it?
The answers are “A lot: billions of pounds every year” and, unless you live in social housing yourself, “You”.
Once you understand how this system works, two important points will become obvious. First, that “just build more affordable housing” isn’t the no-brainer plan people often assume, because it’s so expensive it’ll suck too much money out of everything else. Second, it can only ever be part of the picture not the answer to all our housing problems, not just because the bill would be impossibly high but because we can’t all be subsidising each other!
See “About the data” at the bottom for details on where this information comes from, what it means, and what assumptions I’ve made.
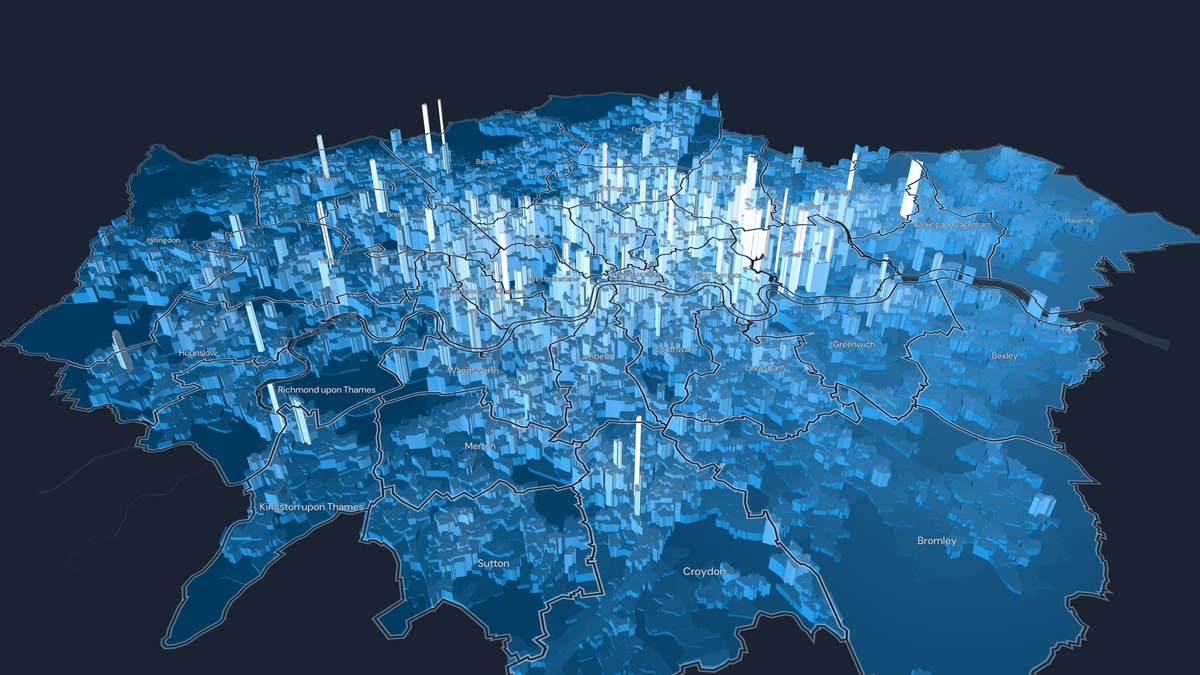
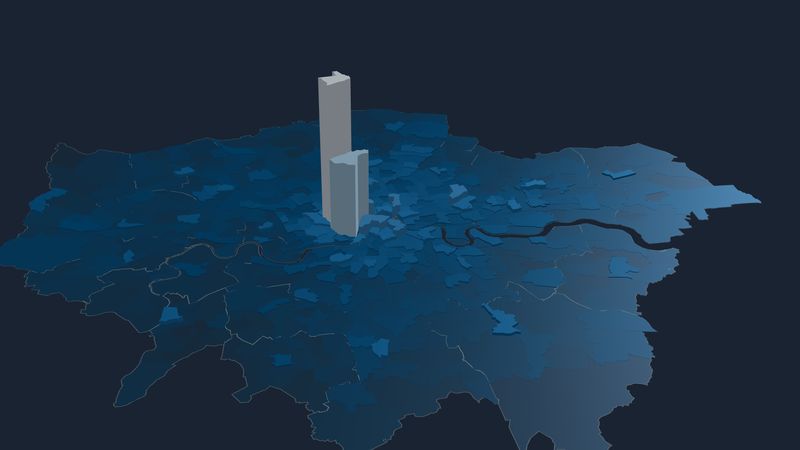
What a social tenancy is worth, borough by borough
The gap between a typical private rent and a social rent for the same size of home, in the same borough.
Across London, social rents barely move. Private rents double.
Typical private rent and social rent for the same size of home in each borough, ranked by the gap between them. Hover or tap a row for the two rents.
What is a social tenancy worth?
The rent a household doesn’t pay, added up over the years and expressed in today’s money. Choose a borough and home size, then change the assumptions.
Social renters have lived in their current home for 12 years on average so far (English Housing Survey 2024–25), but those tenancies are still running, and moving to another social home keeps the benefit.
About the data
- Private rent is the ONS Price Index of Private Rents for August 2026, by borough and bedroom size. It is an average across all existing private tenancies, so new lets cost more and the gap is, if anything, understated.
- Social rent is the Regulator of Social Housing’s average net rent for general needs homes owned by councils and larger housing associations (1,000+ homes), uprated to 2026/27 by the maximum permitted increases. Smaller associations (about 3% of London’s social homes) publish no rents by size and are left out.
- Typical homes, not the same home. The gap compares a typical private home of that size in the borough with a typical social one. Size, condition and location within the borough differ.
- Service charges. Social rents exclude them; private rents generally include them. Where they apply, they would narrow the gap by roughly £20–110 a month.
- Who gains. About 2 in 3 social-renting households in London (66%) get help with rent through Housing Benefit or Universal Credit, covering some or all of their rent. For them, a lower rent partly reduces the benefit bill rather than the household’s own costs. This is a rough estimate: DWP counts for March 2026 (excluding temporary accommodation) set against social-renting households in the 2021 Census. Around 390,000 Housing Benefit and Universal Credit claims in London also help private renters with their rent, though that help is capped at Local Housing Allowance rates, which are set below typical rents.
- Borough totals are notional. They are the rent forgone compared with today’s typical private rents. Nobody could collect them: letting that many homes at market rents would itself move the market.
- 25-year value discounts the gap at 3.5% a year in real terms (the Treasury Green Book rate), with the gap held constant in real terms. The calculator lets you change both.
- City of London is shown as no data. Only 8,583 people live there (Census 2021); ONS publishes no private rent for it, and most City Corporation council homes are on estates in other boroughs.
Sources: ONS Price Index of Private Rents (August 2026); Regulator of Social Housing, social housing stock and rents 2025, uprated to 2026/27 by the maximum permitted increases; ONS Census 2021; DWP Stat-Xplore, Housing Benefit and Universal Credit households (March 2026); ONS subnational estimates of households by tenure, England (2024); MHCLG statutory homelessness statistics, households in temporary accommodation (31 March 2026). Contains public sector information licensed under the Open Government Licence v3.0.