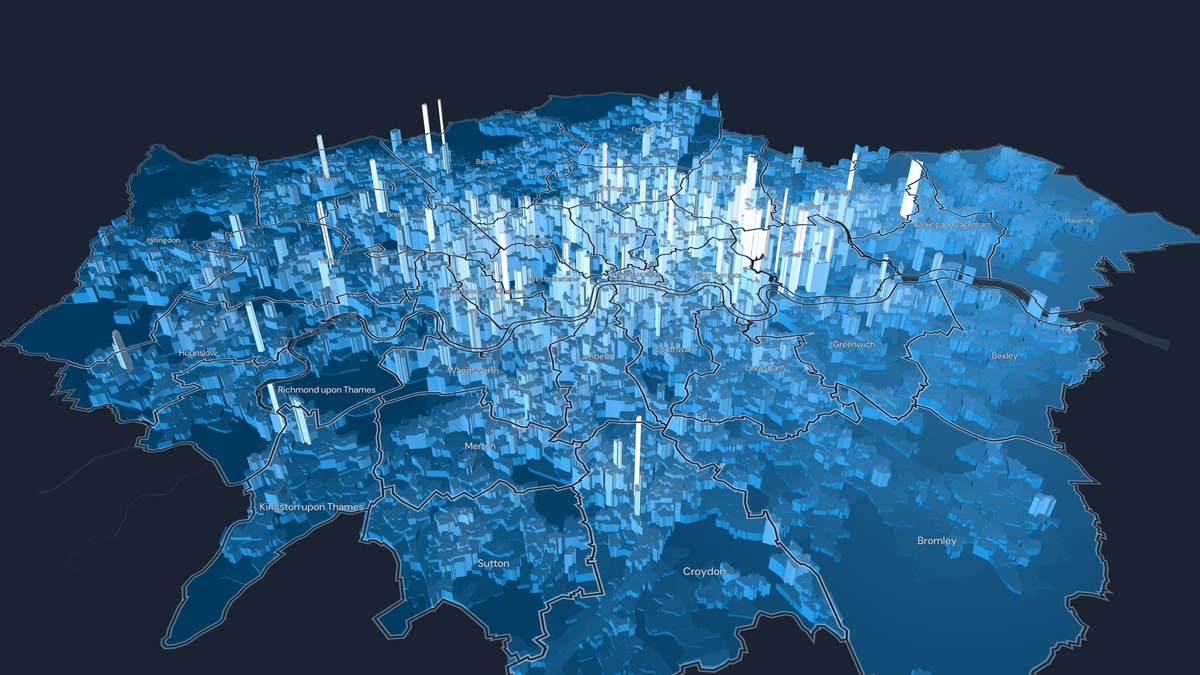
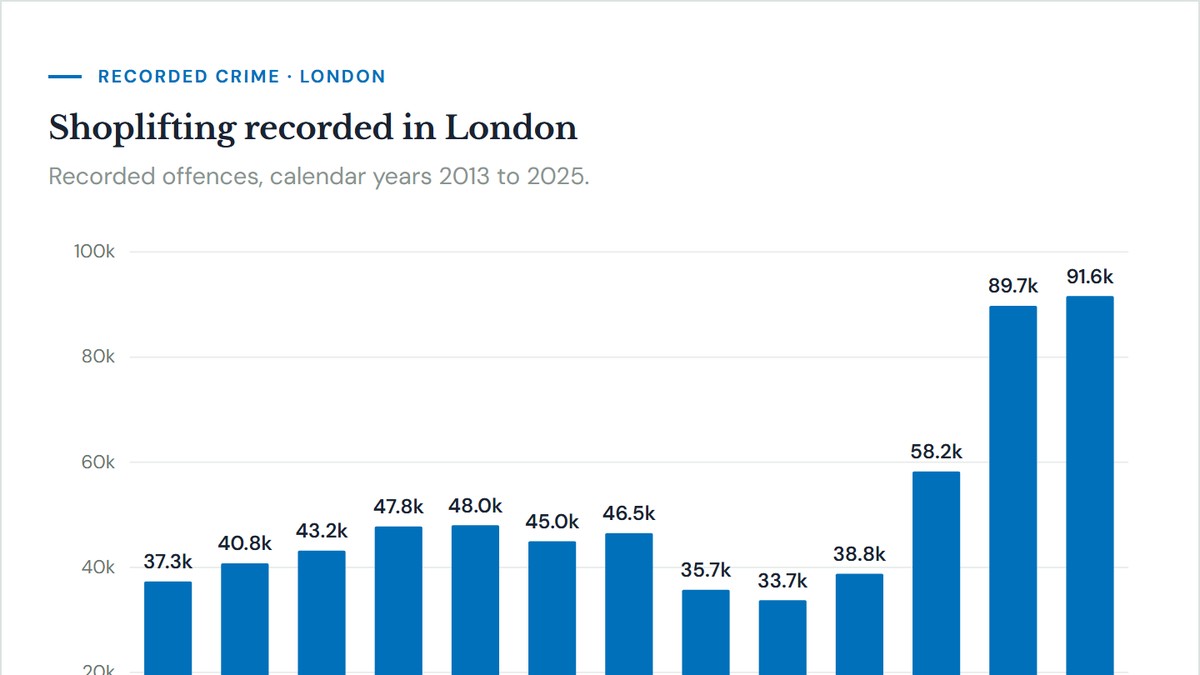
Explore London’s crime map in 3D: scroll down. On a computer? Try the full screen button below each map.
The Law of Crime Concentration
Crime is not spread evenly. Wherever researchers have looked, they have found the same pattern: a small share of places account for a large share of offences.
The finding traces back to Lawrence Sherman’s work in Minneapolis in 1989, which showed that around 3% of addresses generated more than half of all calls for police service. David Weisburd later formalised it as the “law of crime concentration at places”, proposing that roughly 5% of street segments in a city account for about half of its crime. In my experience, this does vary between crimes and I’ve built two interactive crime maps of London so you can explore it yourself.
But crime concentration is more than a curiosity for two reasons.
First: stability. The hot spots do not wander. Weisburd’s Seattle study tracked street segments over sixteen years and found the high-crime places largely stayed high-crime, and the quiet ones stayed quiet, even as the city’s overall crime rate fell substantially. Concentration is a fact about particular places, not a statistical accident that reshuffles each year.
The second is that it holds at a very fine grain. Concentration is much sharper at the level of the street segment or the individual address than at the level of a ward or a borough. The maps here show first ward level and then down to 70 metre hexes, though the crime types vary between the two as some of the crime data does not exist below ward level.
This matters for what police do. If offending were evenly spread, patrol would be a numbers game and enforcement would be whack-a-mole. Because it is concentrated and stable, resource can be targeted. The evidence on hot spot policing is unusually strong for criminology: systematic reviews consistently find that targeting these areas gives you big crime reductions. And contrary to what you might imagine, pushing down the crime hotspot doesn’t work like a half-inflated balloon, simply popping up somewhere else. Crime researchers more often find a diffusion of benefit into surrounding streets than displacement into them.
This is exactly the principle behind my February 2025 report on tackling phone theft. Target the hotspots, the West End in particular, and crime will come down. That is exactly what has now happened.
3D crime maps
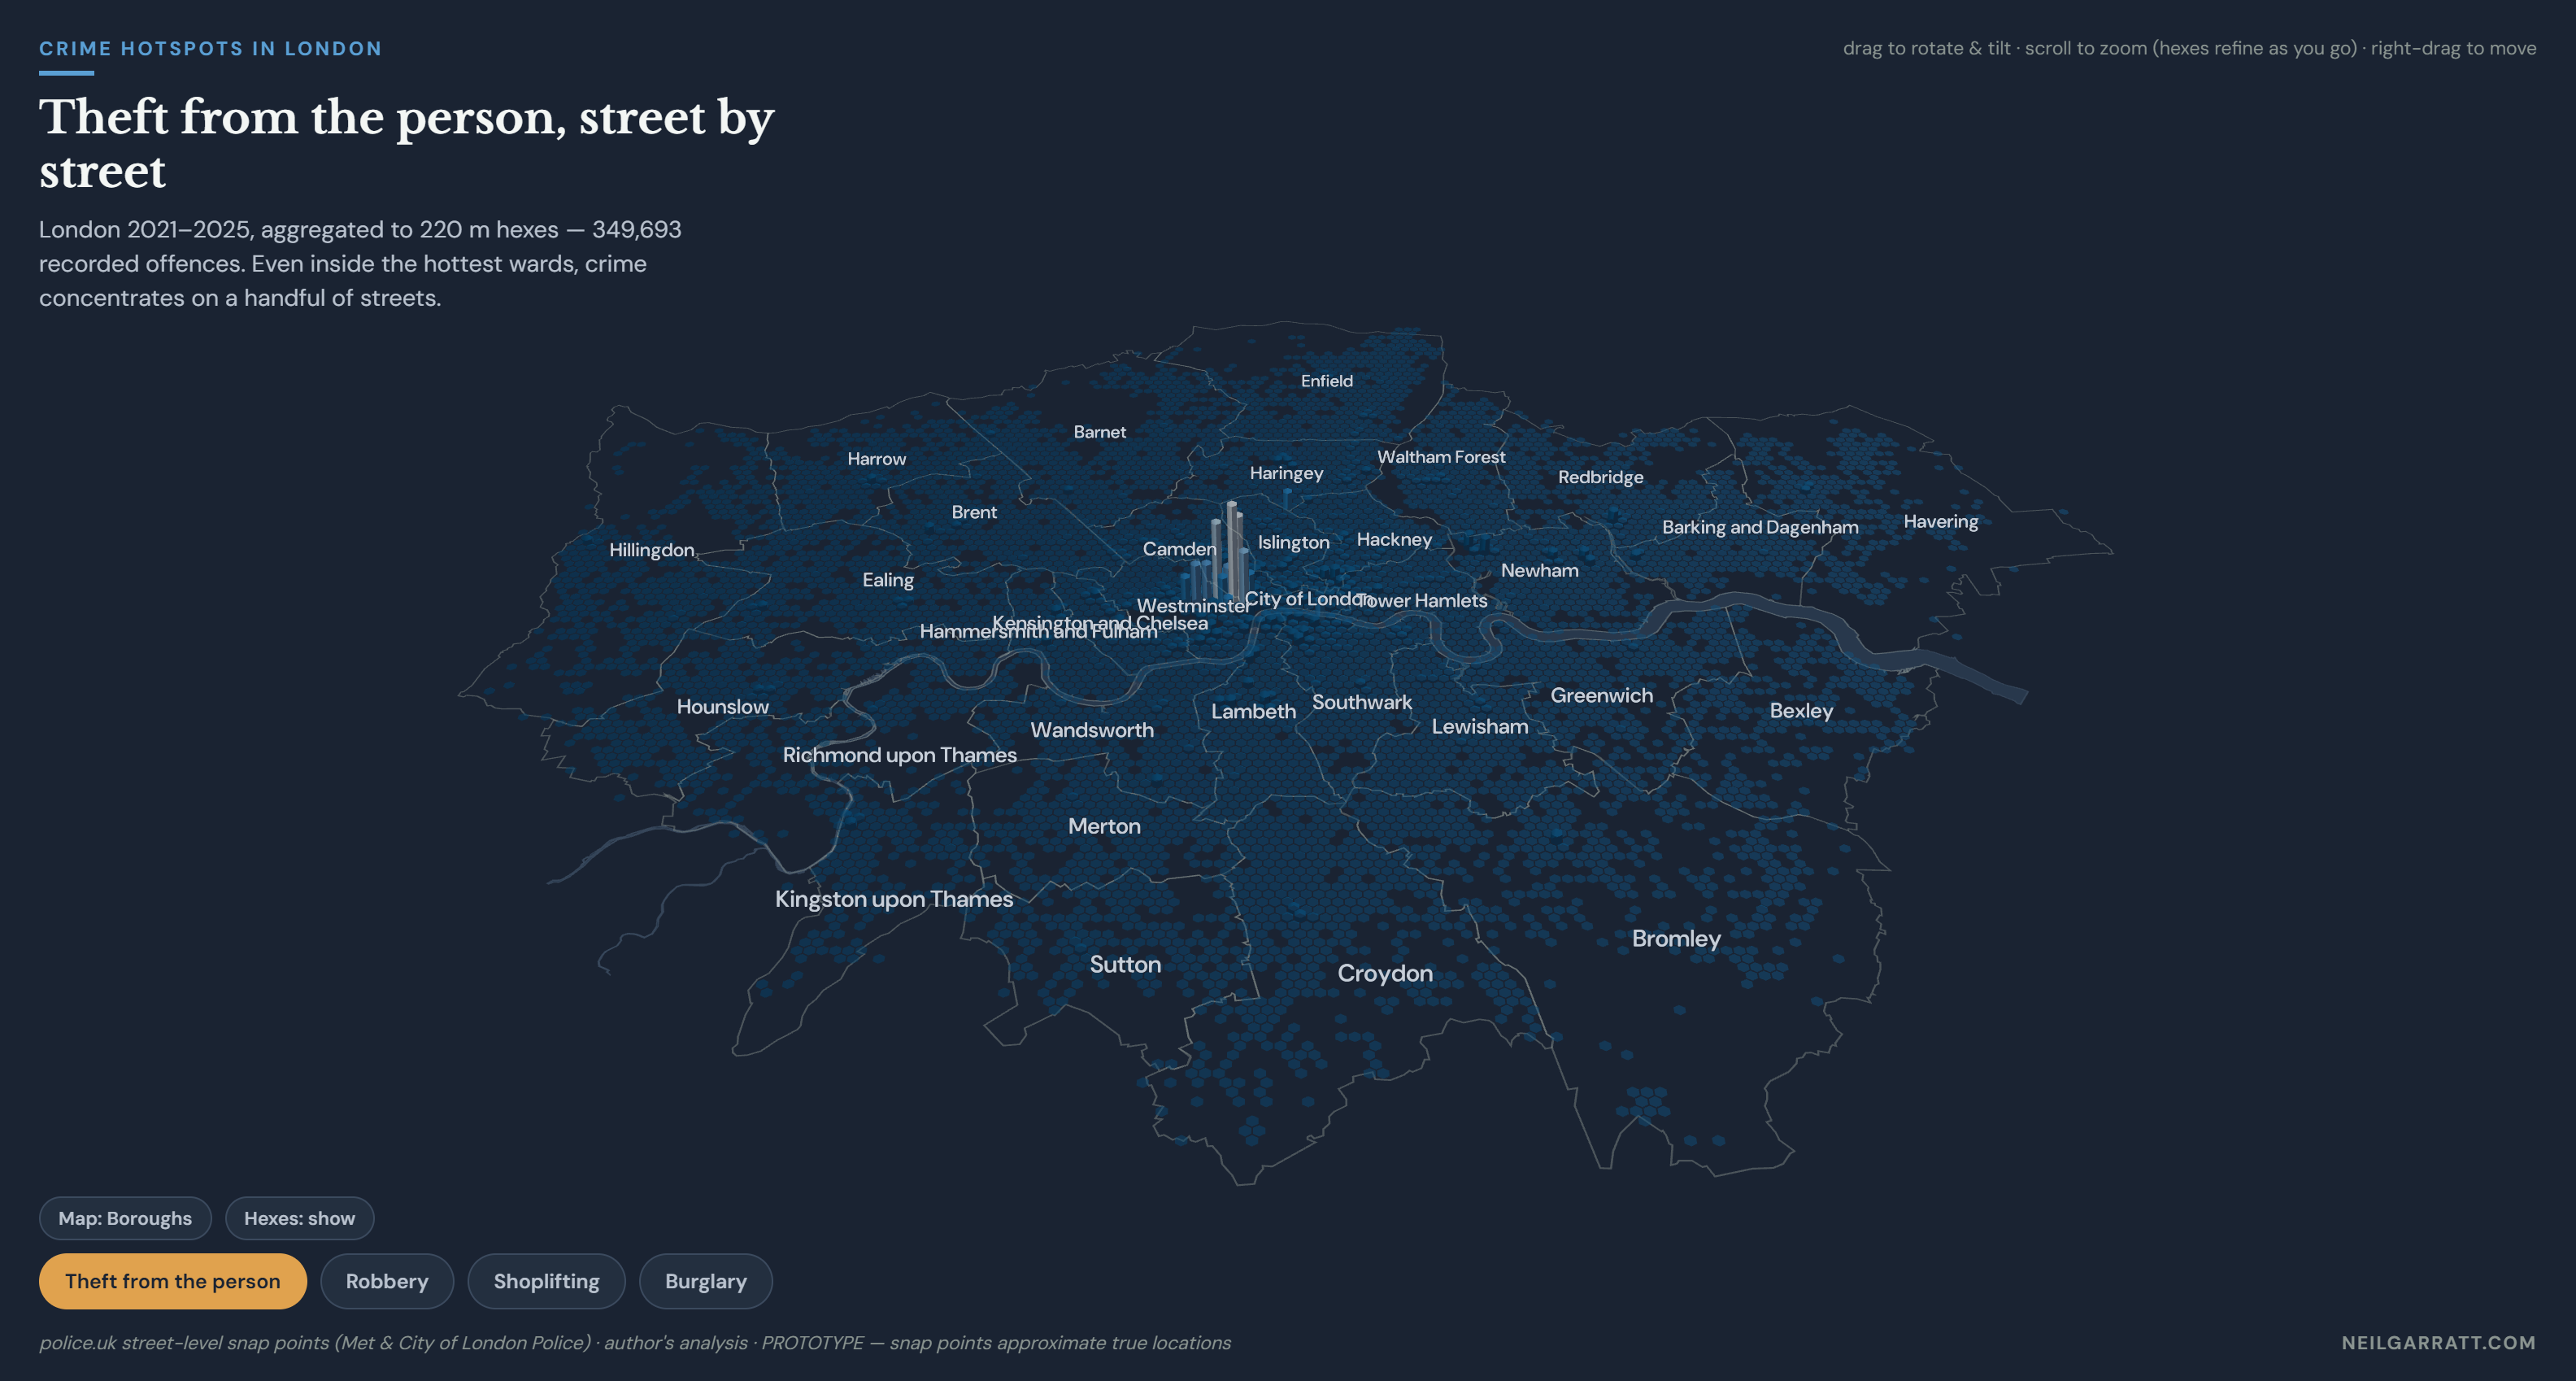
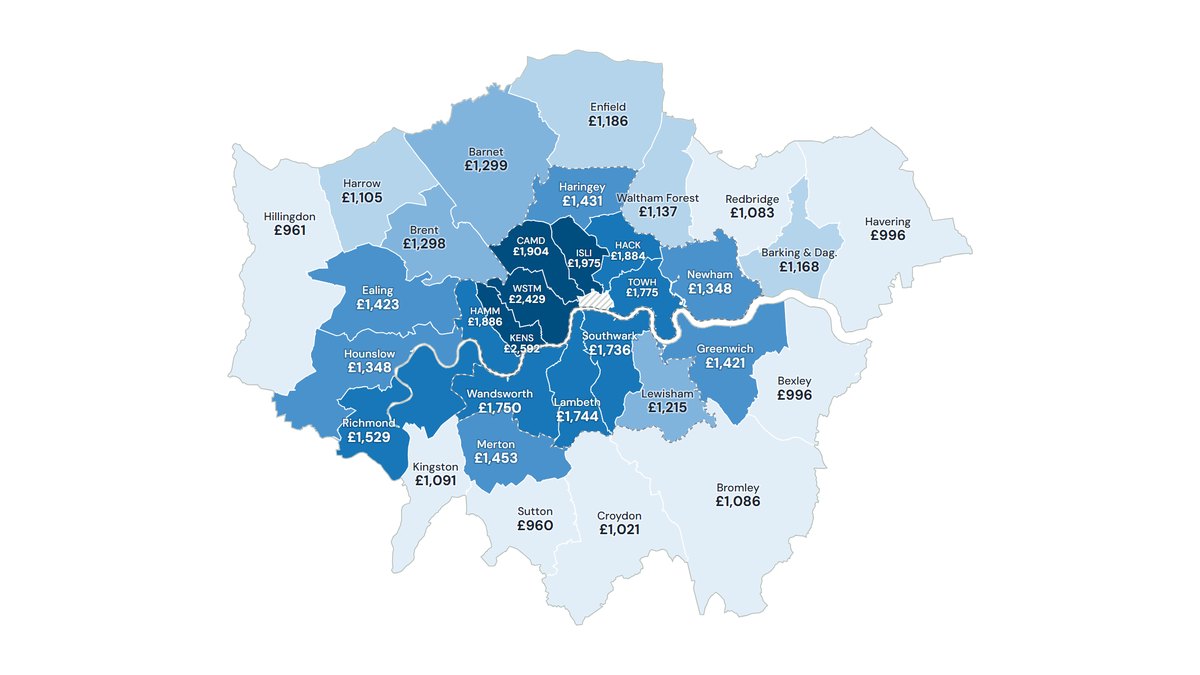
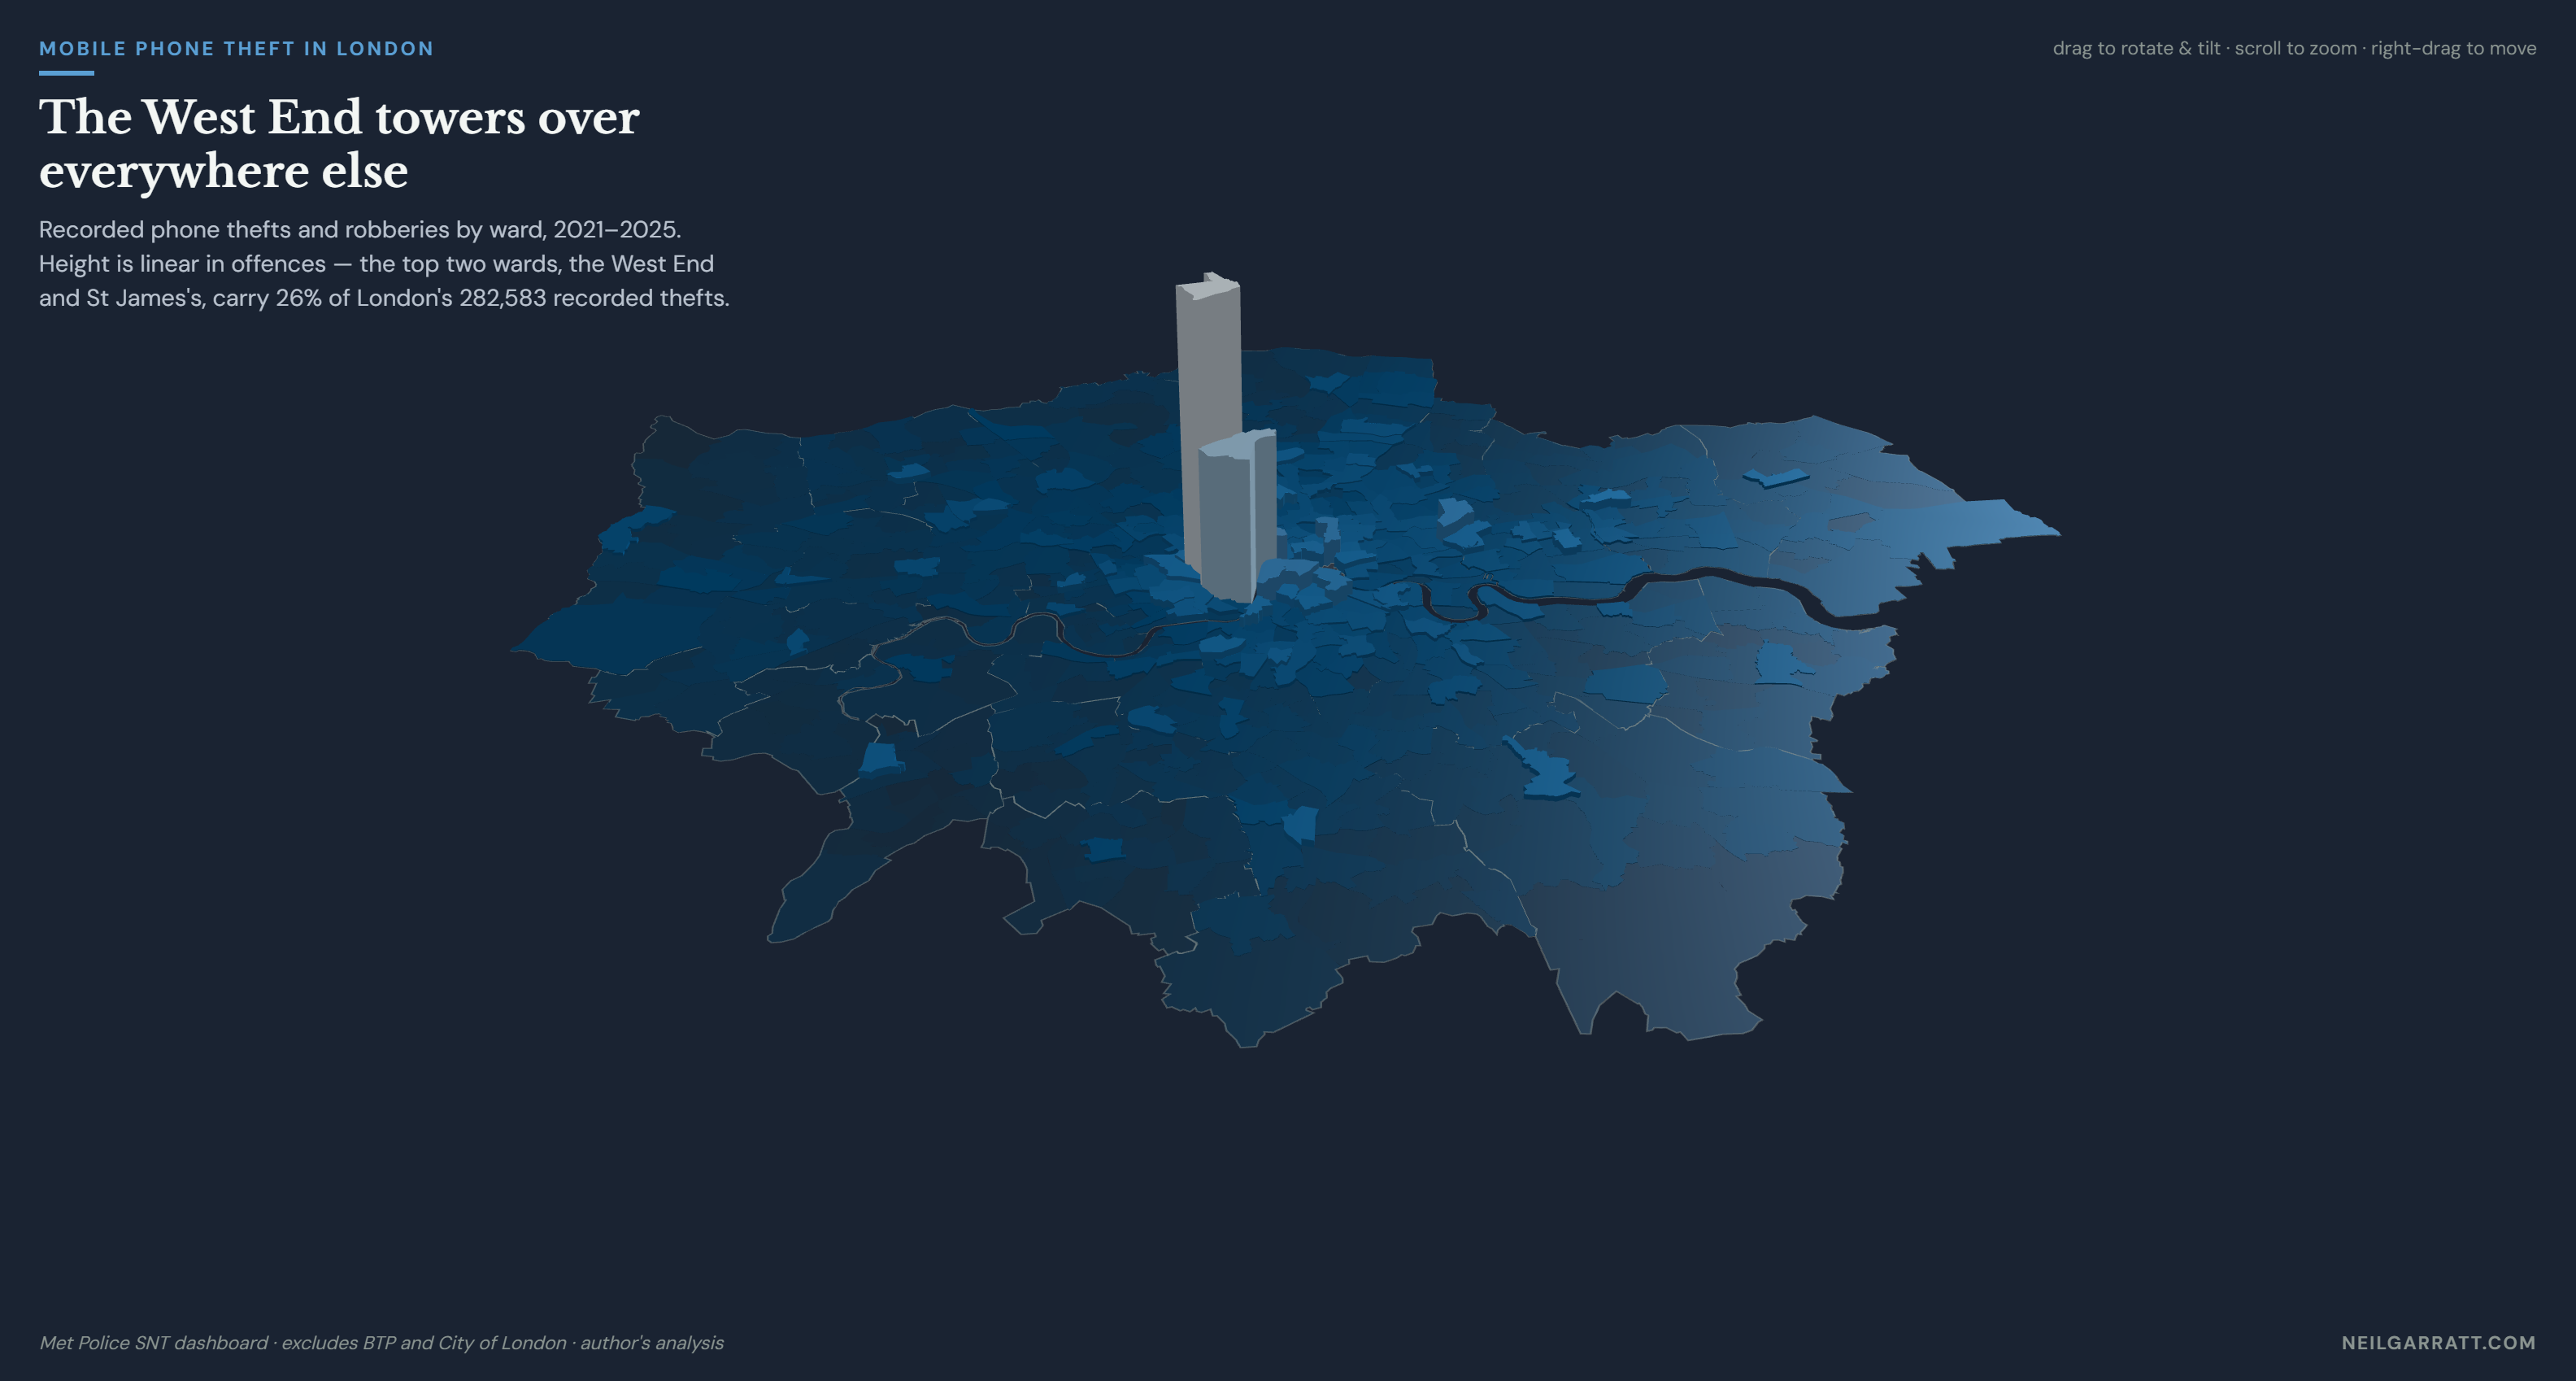
Here are two maps. This first map lets you explore crime at the ward level and across years, so you can see how crime levels have changed. Some crime types only have data for recent years. The second map, further down, takes you to even finer grain, showing that even within the “hotspot wards”, it’s not the whole ward but specific roads that are seeing the big crime levels.
Note: I’ve treated the City of London as a single ward. Its actual wards are tiny, whereas the whole City is quite similar in size to nearby central London wards. Where data comes from the Met Police Dashboard, the City is excluded.
This second more detailed map takes you down to street level, showing individual roads or even sections of roads that are the local crime hotspots. Each 70 metre hexagon shows the crimes reported in that area, based on the police’s GPS snap point data. You can switch to a street map view and toggle off the hexes to get your bearings.
Among other things, you’ll notice that where the ward map shows high crime in West End and St James’s in Westminster, much of that crime is actually clustered around Soho, Shaftesbury Avenue, and Oxford Street.